
Describing Visual Data - C1 English Writing — Exercise 1
Study the two pie charts and choose the option that accurately completes each statement.
Advertisement
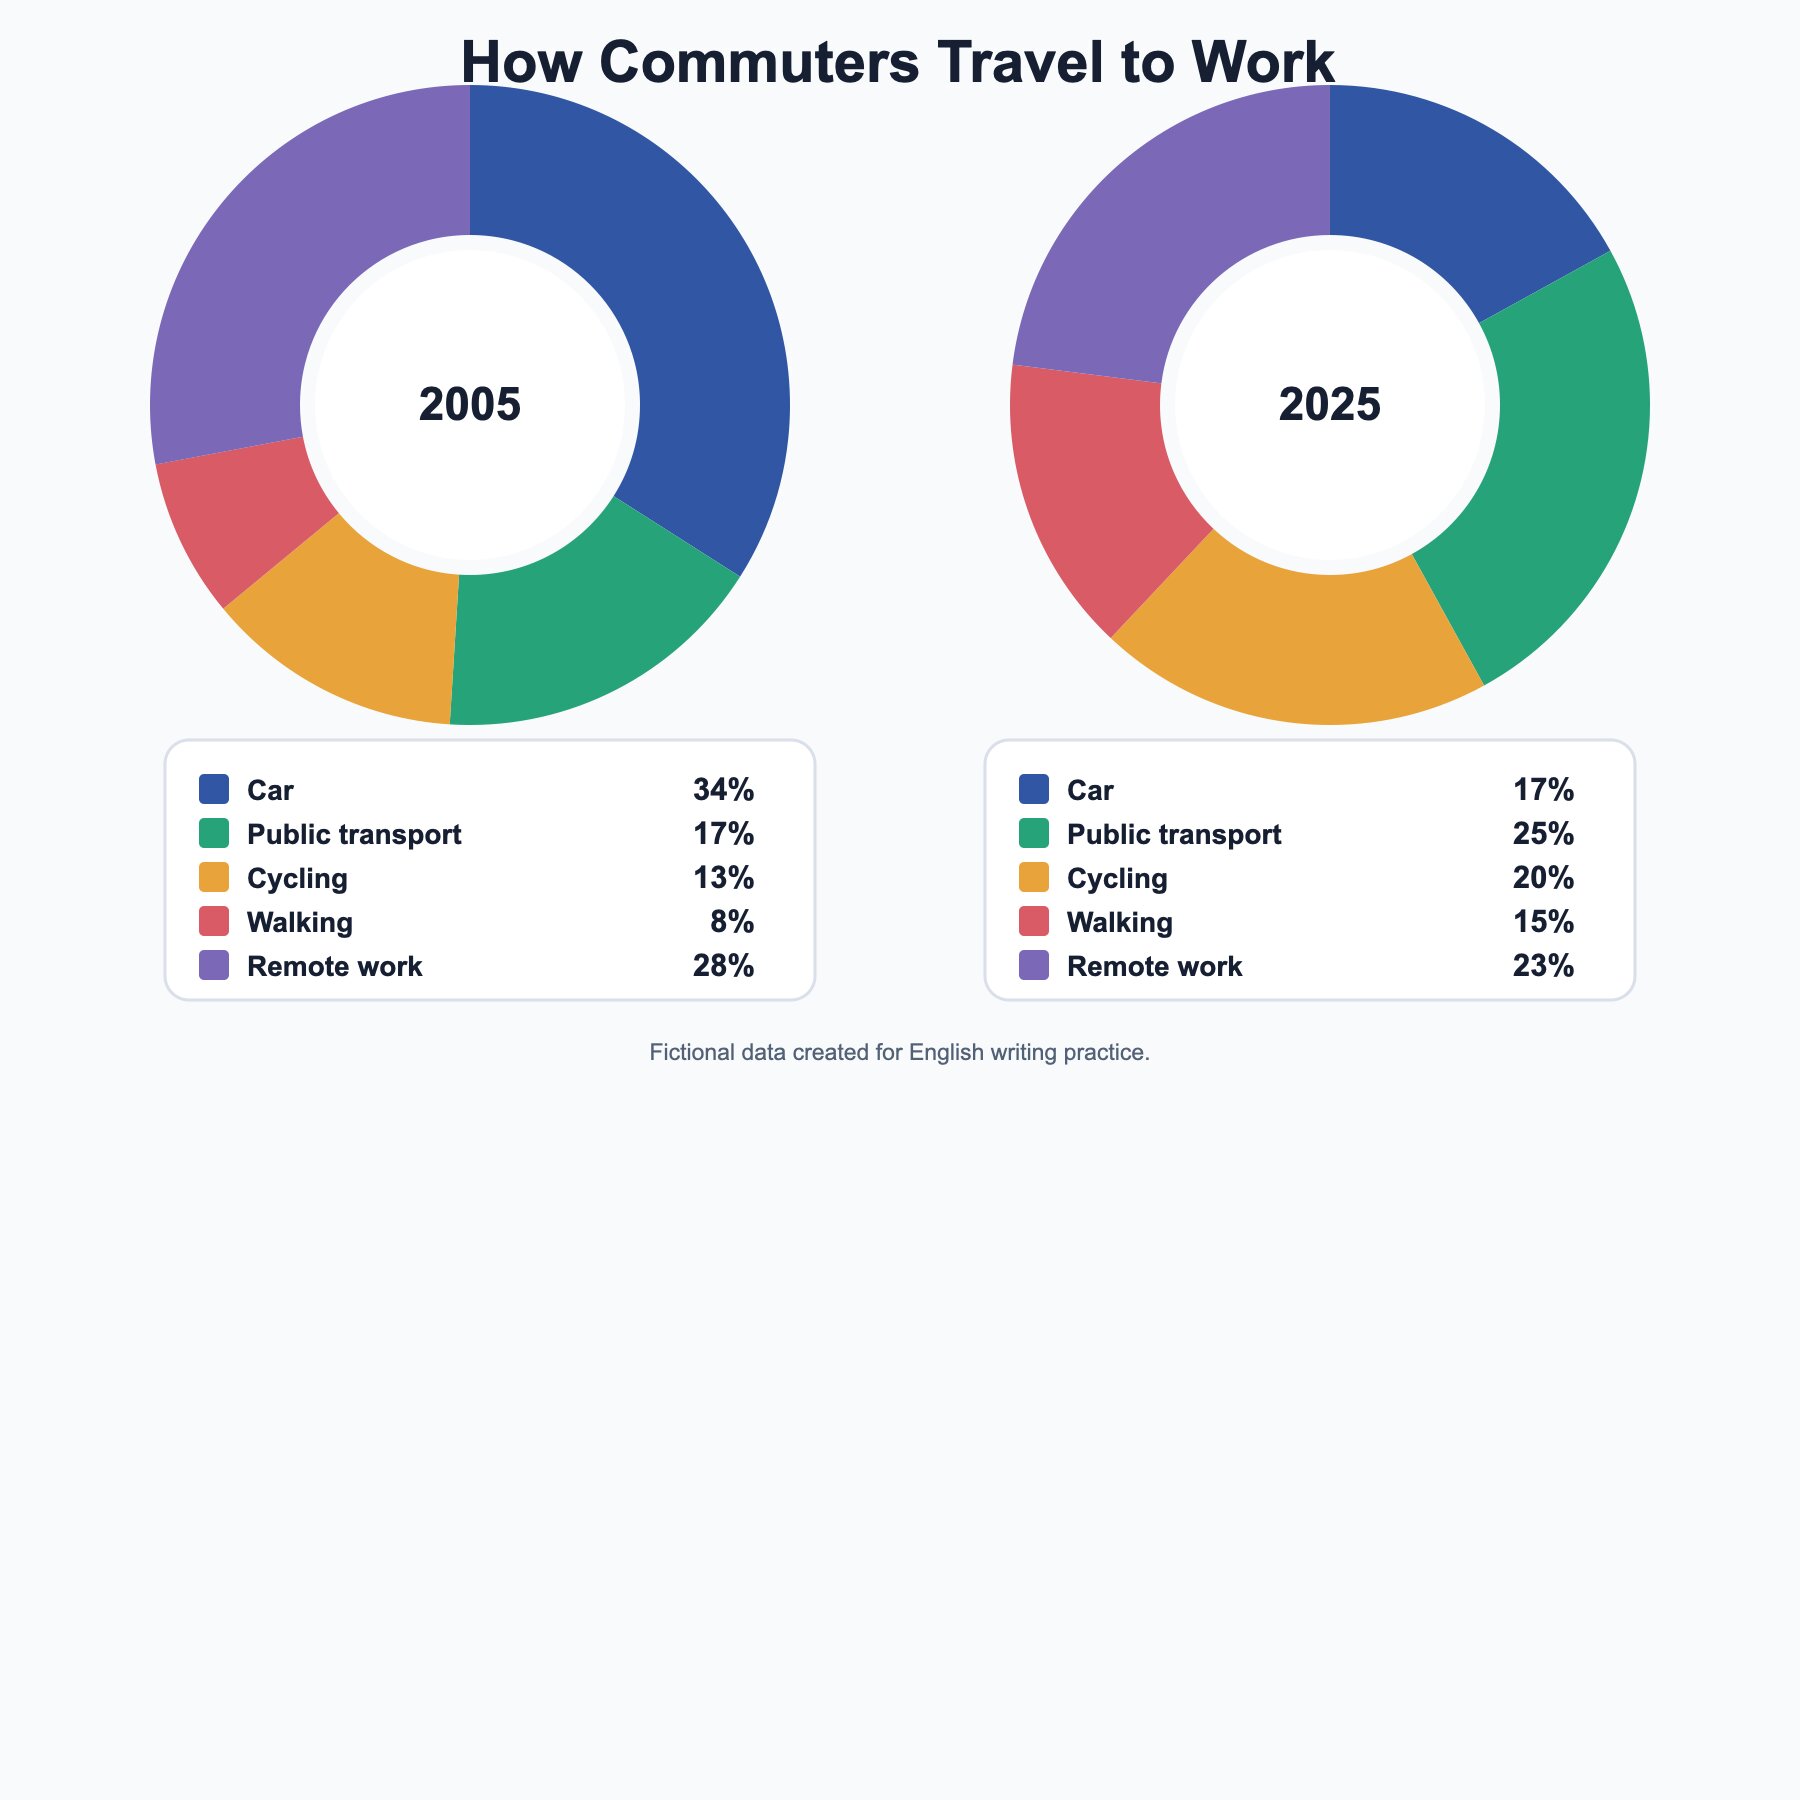
1In 2025, commuting by car accounted for ___ it had in 2005.
2Public transport experienced a ___ between 2005 and 2025.
3Cycling represented ___ of commuters in 2025.
4Walking rose by ___ over the period.
5In 2005, remote work was the ___ category.
6By 2025, public transport had ___ remote work.
7The two categories with identical shares in 2005 were ___.
8The chart indicates a broad shift away from ___ towards active and public transport.
9Remote work showed a ___ of five percentage points.
10Overall, the most substantial absolute change occurred in ___.
Related lessons
Advertisement